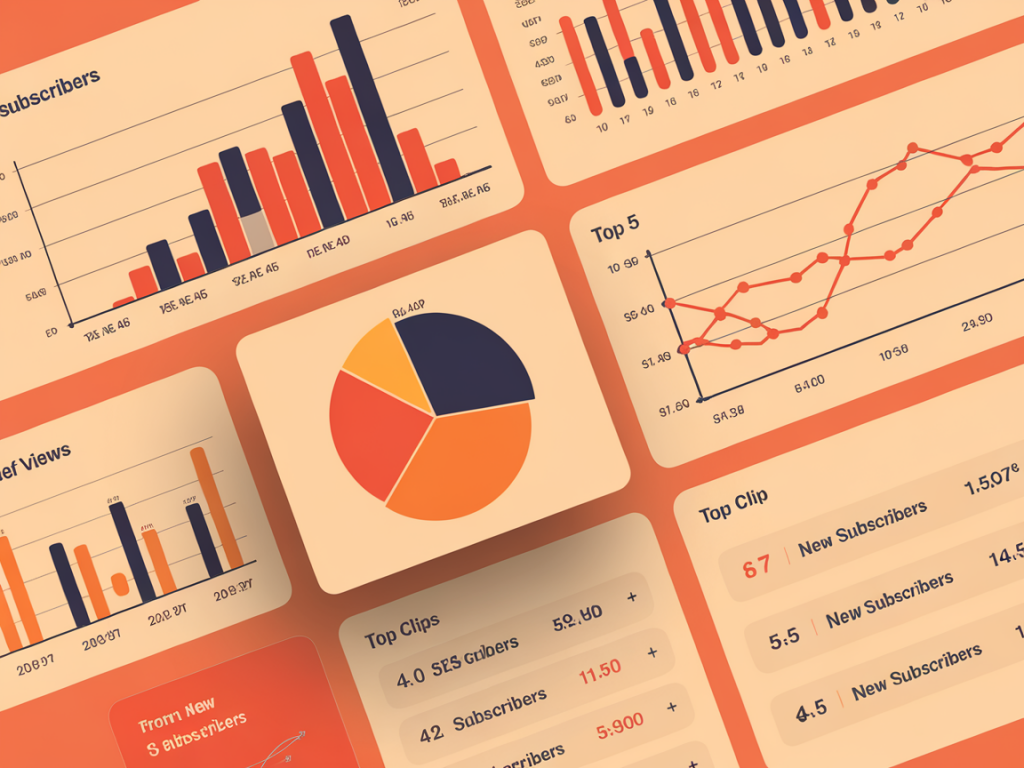
I want to show you the simple analytics dashboard I built that answers the single most useful creator question: which short clips are actually driving new subscribers? I’ve spent years stitching together streaming capture, distribution and analytics; the trick isn’t flashy ML or expensive BI — it’s a small set of reliable signals, a reproducible join key, and a lightweight dashboard that highlights clips that move the needle.
Why most “clip performance” views lie
Views, likes and playtime are helpful, but they don’t tell you whether a clip is bringing new people into your funnel. A clip with 200k views on a platform you already dominate might not produce any net-new subscribers, while a 2k-view clip that lands on the right subreddit at the right time can generate dozens of first-time viewers who hit subscribe.
Common problems I see:
Core idea: link clips to subscribe events with a cheap, reliable key
The dashboard I recommend uses three building blocks:
If you can guarantee that when someone clicks a clip link they carry the clip ID into the subscribe event, you can attribute subscribes to clips. It’s not perfect attribution (people come from many paths), but it’s actionable and reproducible.
What data sources you need
Pick the lowest-friction tools you already use. Typical stack I’ve used successfully:
How to implement the clip identifier
Use a short unique token per clip — 6–8 characters is fine — and include it wherever you can: clip description, pinned comment, link shortener (bit.ly?add UTM), and in the overlay CTA if possible.
Example URL pattern for links in clip descriptions:
| Clip page | https://yourdomain.com/landing?clip=CLP1234 |
| UTM-style | https://yourdomain.com?utm_source=youtube&utm_medium=clip&utm_campaign=CLP1234 |
Both work; the important part is a consistent parameter name (clip or utm_campaign) and a unique token format.
Capturing the subscribe event with clip context
When someone signs up or subscribes, capture the clip token as an event parameter. Practical capture methods:
In GA4 or your analytics tool, create an event called subscribe (or signup) with a parameter clip_id. For example: subscribe {clip_id: "CLP1234", plan: "free"}.
Minimum useful metrics for the dashboard
In the dashboard I display only the metrics that inform action:
Dashboard layout (simple table view)
| Column | Why it matters |
| Clip ID | Join key for all data |
| Title / Platform | Context: where it ran |
| Views | Raw reach |
| Clicks to site | Interest signal |
| Unique visitors with clip_id | Actual audience carrying the token |
| Subscribes attributed | Outcome you care about |
| Conversion rate | Efficiency metric |
| Production time / cost | Unit economics |
Practical visualization tips
Use conditional formatting or a small sparkline to highlight high-conversion clips. I set two visual rules in Looker Studio:
Also include a time-filter so you can view short-term campaigns (7/14/30 days). Clips can have long tails; sometimes a clip spikes three weeks later when picked up by an algorithmic feed.
Common pitfalls and how to avoid them
Tracking leakage: if clicks don’t carry the clip token into the subscription event, your attribution will undercount. Fix by persisting the token in a cookie and reading it on your signup page.
Cross-platform noise: native platform subscribes (YouTube button) won’t include your clip token. Use a blended approach: treat platform-native subscribes as separate and measure uplifts on your owned landing pages.
Sampling and privacy: GA4 and some platforms sample or drop parameters for privacy reasons. Keep a parallel server-side log of subscription events with clip_id when possible — it’s the most robust source.
How I run reproducible tests with this dashboard
Whenever I want to test creative changes, I:
This method surfaces what actually moves people to subscribe, not just what’s “popular.” Over multiple rounds I learned that short, context-rich clips with clear CTAs and a prefilled landing flow convert best — not necessarily the ones with the most production polish.
Fast checklist to ship this in a weekend
If you want, I can produce a template Looker Studio report and a tiny JavaScript snippet to persist clip_id — drop your stack (landing page tech, analytics) and I’ll tailor it so you can get a working dashboard in under a day.