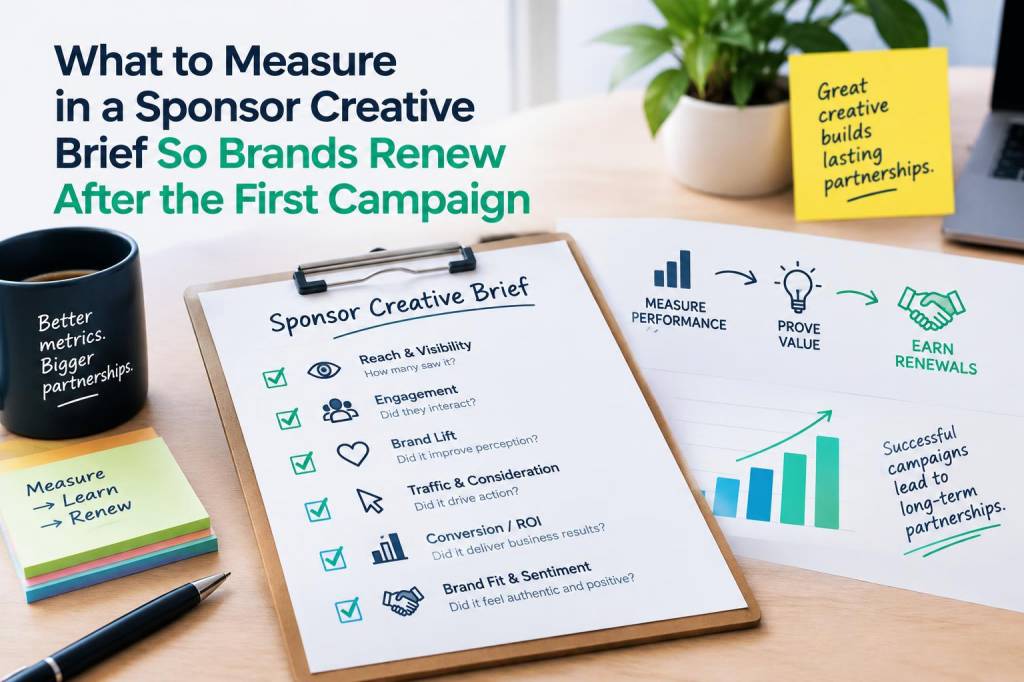
I’m often asked by creators and brand partners the same question: what should live in a sponsor creative brief so the brand wants to renew after the first campaign? From my POV, the brief is not just a list of creative do’s and don’ts — it’s a measurement contract. It sets expectations, reduces ambiguity and surfaces the real outcomes brands care about. Below I walk through the metrics and structure I put into every sponsor creative brief I help build so renewals feel like the obvious next step.
Start with the business outcomes — not vanity metrics
Brands rarely renew because of likes or views alone. They renew when a campaign ties to a measurable business result: awareness, consideration, leads, purchases, trial sign-ups, or retention. In the brief I always put a prioritized list of 2–3 business outcomes and the primary metric that maps to each.
- Primary outcome (e.g., product trial sign-ups) — Primary metric: form completions or tracked trials via UTM + conversion pixel.
- Secondary outcome (e.g., awareness lift) — Secondary metric: ad recall or brand lift survey uplift score.
- Engagement outcome (community activation) — Secondary metric: unique engaged viewers in-stream, average watch time and CTA click-through rate.
Define the measurement plan: what, how, and by when
Vagueness kills renewals. If you commit to “drive sign-ups,” specify the exact funnel event, the tracking implementation, the reporting cadence, and the attribution window.
- What to track: list events (e.g., video start, 10s, 30s, completion, CTA click, landing page load, form submit).
- How to track: specify tools and tags (e.g., Google Analytics 4 event + UTM parameters, Facebook/Meta pixel, TikTok pixel, or a server-side postback).
- Attribution window: e.g., 24-hour click, 7-day view, or 30-day cross-channel—pick what aligns with the purchase cycle.
- Reporting cadence: e.g., daily performance during launch week, weekly summary thereafter, and a final campaign report at T+10 days.
Essential creative performance metrics I include in every brief
These are the numbers that quickly show whether a creative idea is working and whether a brand should invest again.
- Reach and unique viewers: raw and unique. Brands care about incremental reach across their target demo.
- View-through rate (VTR) and completion rate: percentage of viewers who reached the key benchmark (e.g., 30s, 75% completion). Useful for spotting drop-off points.
- Average watch time: signals content relevance and retention — especially important for in-depth demo or product explanation creatives.
- Click-through rate (CTR) on CTAs: visible sign of intent.
- Conversion rate on landing page: measured via UTMs and analytics. This ties content to business outcomes.
- Cost per desired action: e.g., cost per sign-up or cost per website visitor attributed to the sponsored creative.
- Engagement signals: chat messages during a stream, poll answers, saves/bookmarks on platforms where that exists.
Qualitative signals that matter to renewal decisions
Numbers only tell part of the story. I include qualitative checkpoints in the brief so brands understand the brand-safety and sentiment context.
- Brand fit notes: top-line comments on creative tone and audience fit from the creator’s POV.
- Highlight clips & timestamps: short timestamps of the best-performing moments to repurpose for ads.
- Audience sentiment: excerpts from chat or comments that illustrate positive or negative reactions.
- Creative learnings: A/B variant observations — what lines, demos or CTAs landed vs. didn’t.
Benchmarks and targets — set realistic expectations
I always give a reference table that maps metric → definition → suggested target. Benchmarks change by vertical, audience size and platform, so include realistic ranges rather than hard promises.
| Metric | Definition | Example target (streaming & creator placement) |
|---|---|---|
| VTR / Completion | % viewers who reach target timestamp (e.g., 30s) | 40–70% for livestream mentions; 60–85% for short-form pre-recorded |
| CTR on CTA | Clicks divided by impressions or views | 1.0–3.0% typical; >3% is strong for niche audiences |
| Conversion rate | % of CTA clicks that complete desired action | 3–12% depending on funnel friction |
| Cost per acquisition (CPA) | Spend divided by conversions (when paid amplification used) | Varies widely—set brand-specific target with historical data |
Attribution and tracking checklist (copy into your brief)
- Unique UTM per creative variant (utm_source=creator, utm_campaign=campaign_name, utm_content=variant)
- Pixel/postback installed and verified on conversion pages before go-live
- UTM click validation: generate test clicks and confirm events in GA4 / ad platform
- Server-side fallback for mobile app journeys or platforms with limited tracking (e.g., deep links)
Creative experiment plan — what to test, and when to scale
Brands love a tidy test-and-scale approach. In the brief I define a short test window (3–7 days or first 10k impressions), the variant matrix, and scale triggers.
- Variant A: product-first demo with direct CTA
- Variant B: story-led narrative with soft CTA + link in description
- Scale trigger: if CTR > target and conversion rate beats baseline by X%, extend placement and increase paid amplification.
Reporting format — make it bite-sized and actionable
Brands are busy. I propose a standard report that’s quick to scan and clearly recommends next actions.
- Executive summary: one-sentence verdict (e.g., “Performance exceeded expectations on CTR but needs landing page tweaks to improve conversions”).
- Top metrics table (as above) with target vs. actual.
- Creative highlights: timestamps, clips, quotes.
- Recommended next steps: optimize landing page, re-run winning creative, try new CTA.
Renewal triggers — make the decision obvious
Finally, frame renewal around simple checks. When the brief includes clear triggers, stakeholders can greenlight continuation without endless debate. Examples I use:
- Renew if CPA is within target range and reach exceeded X unique users in target demo.
- Renew with creative refresh if CTR is strong but conversion rate lags (suggest A/B test of landing page).
- Pause and investigate if watch time or VTR drops below Y% — likely a creative fit problem.
Done well, a creative brief becomes a living document: it aligns expectations, captures learning quickly, and gives brands a repeatable basis for decision-making. I make these briefs practical and measurable because that’s what gets campaigns renewed — not guesswork, but defensible outcomes and a clear roadmap to improve them.